Impurity Profiling and Control in Raltegravir Potassium
BACKGROUND
In order to ensure the safety and efficacy of a drug substance, it is of utmost importance to obtain high purity of these during the manufacturing process. Failure to promptly identify and eliminate impurities can lead to batch failures and significant financial losses. This case study discusses how a team of experts from Lupin Manufacturing Solutions identified and traced the source of an unexpected impurity RLTRC-6 during the manufacturing of Raltegravir Potassium, a key antiretroviral medication. They subsequently implemented Corrective and Preventive Actions (CAPA) to control levels of the impurity, thereby establishing a robust process and reducing the batch failure rate.
THE PROBLEM
During the manufacturing process, performance qualification of Raltegravir Potassium (Stage RLG-II), an in- process sample exhibited a failure attributed to an unforeseen elevation in the concentration of the impurity RLTRC-6. The impurity levels detected were measured at 0.14%, surpassing the established threshold of 0.12%. Consequently, it became imperative to identify and mitigate the source of this impurity.
THE CHALLENGE
Historical checks did not conclusively prove any errors in the manufacturing process, thus making it difficult to identify any root causes.
Lab validation data: Batches in the lab showed an impurity trend ranging from ND (Not Detected) to 0.03%, which was well within the normal limits.
- Historical data from the plant batches: Impurity trend for the last 24 months was verified, and no abnormality was reported for Impurity RLTRC-6.
- Trend: The levels of impurity RLTRC-6 ranged from 0.08% to 0.25%, which markedly deviated from the previous trend of non-detectable (ND) to 0.12% in the scale up batches. This significant variation necessitated further investigation.
INVESTIGATION & OBSERVATION:
Since historic data did not divulge any specific abnormality, the Process Development (PD) team conducted a comprehensive literature review to identify the source of impurity. From the review they discovered that – RLTRC-6, can be generated via two pathways:
- Pathway-1: Impurity carryover from KSM
Impurity RLTRC-6 can form during the synthesis of Raltegravir, originating from key starting material RLT-II, which transforms to the intermediate RLG-I, subsequently leading to the formation of RLTRC-6.
This possibility was excluded after verifying the input lot analysis data, which indicated impurity levels of 0.02%. These levels were within the normal limits, thereby ruling out this source as the cause of the impurity.
- Pathway-2:Degradation through the process
Degradation can happen, potentially in the presence of palladium catalyst, base or alcoholic solvent.
PD team conducted a series of experiments to investigate, to verify if the impurity was generated as per pathway-2
Experiment 1: Impact of Duration of Hydrogenation reaction in Presence of Palladium catalyst
To study the impact of duration of hydrogenation in presence of Pd catalyst, the team assessed different time intervals for the hydrogenation reaction (Table 1) –
| Expt. no. | Hydrogenation time | % Impurity in RLG-I |
| 1 | 2 hours | 0.06 |
| 2 | 6 hours | 0.09 |
Table 1: Impact of duration of hydrogenation reaction in on impurity formation
Conclusion: There was no significant change in the impurity formation with increasing reaction time, ruling out this possibility and promoting further investigation.
Experiment 2: Impact of Holding Time of Reaction Mass During Filtration
Since there was no significant impact of hydrogenation time on impurity formation, the team focused on filtration, which is carried out for the catalyst removal (post hydrogenation reaction). The filtration process was assessed for different time intervals (Table 2) to check the impact of holding time of reaction mass on impurity formation/ enrichment.
| Expt. no. | Holding time for reaction mass | % Impurity in RLG-I |
| 1 | 0 hour | 0.06 |
| 2 | 2 hours | 0.11 |
| 3 | 4 hours | 0.17 |
| 4 | 12 hours | 0.32 |
Table 2: Impact of holding time of reaction mass on impurity production
Conclusion: This study showed a clear time-dependent increase in the levels of impurity, establishing a direct correlation between the holding time and percentage of impurity. This proved that the root cause of impurity formation lies in filtration time.
Experiment 3: Plant Data Comparison
To confirm lab findings, the plant data was compared to establish the connection between filtration time after hydrogenation versus impurity formation (Table 3, Fig 1).
| Batch no. | Catalyst Separation Filtration time (in mins) | % RLTRC-6 impurity in RLG-II |
| 1 | 155 | 0.08 |
| 2 | 170 | 0.15 |
| 3 | 190 | 0.25 |
| 4 | 100 | 0.06 |
Table 3: Impact of filtration time after hydrogenation on impurity formation
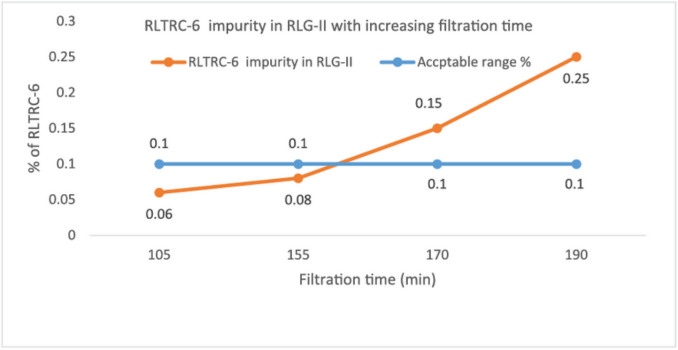
Fig 1: Impact of filtration time after hydrogenation on impurity formation
Conclusion: The lab data corroborated the study findings, as there was a clear correlation between the filtration time and the levels of this impurity. This helped us to confirm the hypothesis that the root cause for the increase in the levels of this impurity lies in the filtration time.
CORRECTIVE AND PREVENTIVE ACTIONS (CAPA):
Upon identification of the root cause, the team initiated a Corrective and Preventive Action (CAPA) procedure to effectively address the issue and enhance the robustness of the process. The following actions were implemented
Issue: There was no defined duration for catalyst filtration in the Batch Production Record (BPR).
Action: Batch Production Record was revised to include a filtration time of not more than 150 minutes.
CAPA Effectiveness:
Post-CAPA implementation, several batches were executed on scale and impurity levels remain within acceptable range (Fig 2), thus confirming the effectiveness of CAPA.
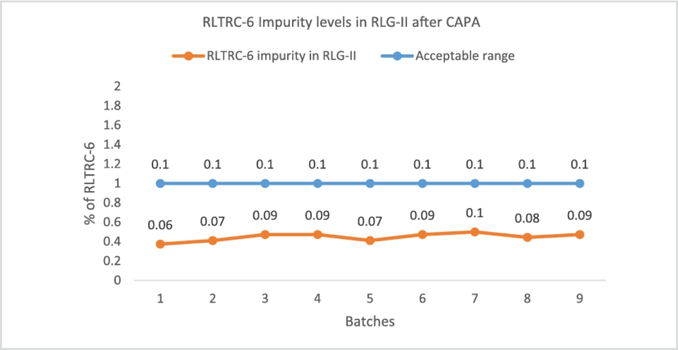
Fig 2: Confirmation of impurity levels contained within acceptable limits after CAPA measure
Conclusion
The investigation and subsequent corrective actions undertaken to control RLTRC-6 during the production of Raltegravir Potassium have demonstrated effectiveness. Through root cause identification and the implementation of a Corrective and Preventive Action (CAPA) plan, impurity levels were controlled within acceptable limits. This has resulted in a robust and reliable process that ensures the consistent quality and safety of the product.
The successful implementation of Corrective and Preventive Actions (CAPA) measures yielded several advantages:
- Enhanced process capability (CPK).
- Consistency in product quality.
- Increased cost competitiveness.
This case study underscores innovation and continuous improvement in the pharmaceutical sector, enhancing quality assurance and improving the supply of medicinal products, in alignment with ICH Q12 guidelines.