


Mumbai, October 27, 2021: Pharma major Lupin Limited [BSE: 500257 | NSE: LUPIN] reported its financial performance for the quarter ending September 30, 2021. These unaudited results were taken on record by the Board of Directors at a meeting held today.
Amt in INR mn
| Particulars | Quarter | ||||||
|---|---|---|---|---|---|---|---|
| Q2 FY2022 | Q1 FY2022 | QoQ Growth % | Q1 FY2022** | QoQ Growth % | Q2 FY2021 | YoY Growth % | |
| Sales | 40,034 | 42,374 | ↓ 5.5% | 38,640 | ↑ 3.6% | 37,818 | ↑ 5.9% |
| EBITDA | 6,285 | 9,926 | ↓ 36.7% | 6,192 | ↑ 1.5% | 6,061 | ↑ 3.7% |
| EBITDA Margin (%) | 15.7% | 23.4% | ↓ 770 bps | 16.0% | ↓30 bps | 16.0% | ↓ 30 bps |
| Adjusted PBT* | 3,825 | 7,503 | ↓ 49.0% | 3,769 | ↑1.5% | 3,598 | ↑ 6.3% |
*adjusted for Impairment & Business Compensation Expenses in Q2 FY2022 **adjusted for NCE Licensing Income
| Particulars | Q2 FY2022 | % of sales | Q1 FY2022 | % of sales | QoQ Gr% | Q2 FY2021 | % of sales | YoY Gr% |
|---|---|---|---|---|---|---|---|---|
| Sales | 40,034 | 100.0% | 42,374 | 100.0% | -5.5%* | 37,818 | 100.0% | 5.9% |
| Other operating income | 879 | 2.2% | 328 | 0.8% | 168.0% | 532 | 1.4% | 65.2% |
| Total Revenue from operations | 40,913 | 102.2% | 42,702 | 100.8% | -4.2% | 38,350 | 101.4% | 6.7% |
| Material cost | 16,265 | 40.6% | 15,280 | 36.1% | 6.4% | 13,817 | 36.5% | 17.7% |
| Gross Profit (Excl. Other op. income)1 | 23,769 | 59.4% | 27,094 | 63.9%* | -12.3% | 24,001 | 63.5% | -1.0% |
| Employee cost2 | 7,586 | 18.9% | 7,837 | 18.5% | -3.2% | 6,854 | 18.1% | 10.7% |
| Manufacturing & Other expenses1/2 | 11,425 | 28.5% | 10,309 | 24.3% | 10.8% | 11,325 | 29.9% | 0.9% |
| Other Income | 728 | 1.8% | 278 | 0.7% | 161.9% | 250 | 0.7% | 191.2% |
| Forex Loss / (Gain) | 80 | 0.2% | (372) | -0.9% | -121.5% | 543 | 1.4% | -85.3% |
| EBITDA | 6,285 | 15.7% | 9,926 | 23.4%* | -36.7%* | 6,061 | 16.0% | 3.7% |
| Depreciation, Amortization & Impairment Expense | 2,116 | 5.3% | 2,088 | 4.9% | 1.3% | 2,127 | 5.6% | -0.5% |
| EBIT | 4,169 | 10.4% | 7,838 | 18.5% | -46.8% | 3,934 | 10.4% | 6.0% |
| Finance cost | 344 | 0.9% | 335 | 0.8% | 2.7% | 336 | 0.9% | 2.4% |
| Adjusted Profit Before Tax (PBT) | 3,825 | 9.6% | 7,503 | 17.7%* | -49.0%* | 3,598 | 9.5% | 6.3% |
| Business Compensation Expense3 | 18,796 | 47.0% | – | 0.0% | – | 0.0% | ||
| Impairment Expense4 | 7,077 | 17.7% | – | 0.0% | – | 0.0% | ||
| Profit Before Tax (PBT) | (22,048) | -55.1% | 7,503 | 17.7%* | 3,598 | 9.5% | ||
| Tax | (1,099) | -2.7% | 2,023 | 4.8% | 1,467 | 3.9% | ||
| Profit After Tax (PAT) | (20,949) | -52.3% | 5,480 | 12.9% | 2,131 | 5.6% | ||
| (+) Share of Profit from JV | 0 | 0.0% | 2 | 0.0% | 4 | 0.0% | ||
| (-) Non-Controlling Interest | 31 | 0.1% | 57 | 0.1% | 25 | 0.1% | ||
| Profit/(Loss) for the period | (20,980) | -52.4% | 5,425 | 12.8% | 2,110 | 5.6% |
| Particulars | H1 FY2022 | % of sales | H1 FY2021 | % of sales | YoY Gr% |
|---|---|---|---|---|---|
| Sales | 82,408 | 100.0% | 72,504 | 100.0% | 13.7% |
| Other operating income | 1,207 | 1.5% | 1,125 | 1.6% | 7.3% |
| Total Revenue from operations | 83,615 | 101.5% | 73,629 | 101.6% | 13.6% |
| Material cost | 31,545 | 38.3% | 26,696 | 36.8% | 18.2% |
| Gross Profit (Excl. Other op. income)1 | 50,863 | 61.7% | 45,808 | 63.2% | 11.0% |
| Employee cost2 | 15,423 | 18.7% | 14,790 | 20.4% | 4.3% |
| Manufacturing & Other expenses1/2 | 21,691 | 26.3% | 20,728 | 28.6% | 4.6% |
| Other Income | 963 | 1.2% | 683 | 0.9% | 41.0% |
| Forex Loss / (Gain) | (292) | -0.4% | 723 | 1.0% | -140.4% |
| EBITDA | 16,211 | 19.7% | 11,375 | 15.7% | 42.5% |
| Depreciation, Amortization & Impairment Expense | 4,204 | 5.1% | 4,273 | 5.9% | -1.6% |
| EBIT | 12,007 | 14.6% | 7,102 | 9.8% | 69.1% |
| Finance cost | 679 | 0.8% | 779 | 1.1% | -12.8% |
| Adjusted Profit Before Tax (PBT) | 11,328 | 13.7% | 6,323 | 8.7% | 79.2% |
| Business Compensation Expense3 | 18,796 | 22.8% | – | 0.0% | |
| Impairment Expense4 | 7,077 | 8.6% | – | 0.0% | |
| Profit Before Tax (PBT) | (14,545) | -17.6% | 6,323 | 8.7% | |
| Tax | 924 | 1.1% | 3,110 | 4.3% | |
| Profit After Tax (PAT) | (15,469) | -18.8% | 3,213 | 4.4% | |
| (+) Share of Profit from JV | 2 | 0.0% | 9 | 0.0% | |
| (-) Non-Controlling Interest | 89 | 0.1% | 43 | 0.1% | |
| Profit/(Loss) for the period | (15,556) | -18.9% | 3,179 | 4.4% |
Amt in INR mn
| Particulars | Q2 FY22 | Q1 FY22 | Growth QoQ | Q2 FY21 | Growth YoY |
|---|---|---|---|---|---|
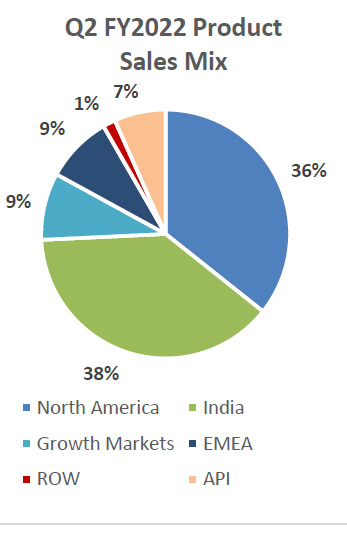
| North America | 14,291 | 13,330 | 7.2% | 13,984 | 2.2% |
| India | 15,435 | 16,362 | -5.7% | 13,323 | 15.9% |
| Growth Markets | 3,490 | 3,328 | 4.9% | 2,918 | 19.6% |
| EMEA | 3,484 | 2,613 | 33.3% | 3,259 | 6.9% |
| ROW | 656 | 548 | 19.7% | 595 | 10.3% |
| Total Formulations | 37,356 | 36,181 | 3.2% | 34,079 | 9.6% |
| API | 2,678 | 2,459 | 8.9% | 3,739 | -28.4% |
| Total Sales | 40,034 | 38,640 | 3.6% | 37,818 | 5.9% |
| NCE licensing income | – | 3,734 | – | ||
| Consolidated Sales | 40,034 | 42,374 | -5.5% | 37,818 | 5.9% |
Q2 FY2022 sales were USD 184 mn compared to USD 172 mn in Q1 FY2022 and USD 180 mn in Q2 FY2021
The Company filed 4 ANDAs in the quarter, received 1 ANDA approval from the U.S. FDA, and launched 3 products in the quarter in the U.S. market. The Company now has 165 products in the U.S. generics market.
Lupin continues to be the 3rd largest pharmaceutical player in both U.S. generic market and US total market by prescriptions (IQVIA MAT September 2021). Lupin is the market leader in 55 products in the U.S. generics market and amongst the Top 3 in 120 of its marketed products (market share by extended units, IQVIA June 2021)
During the quarter, we scaled down the US Specialty operations and have reduced the burn going forward. We also booked one-time costs of INR 326 mn related to US Specialty business.
India
Lupin’s India formulation sales for Q2 FY2022 were INR 15,435 mn, down 5.7% as compared to INR 16,362 mn in Q1 FY2022, up 15.9% as compared to INR 13,323 mn in Q2 FY2021; accounting for 38% of Lupin’s global sales.
India Region Formulations sales grew by 16.0% in the quarter as compared to Q2 FY2021.
Lupin is the 6th largest company in the Indian Pharmaceutical Market (IQVIA MAT September 2021).
Growth Markets (LATAM and APAC)
Lupin’s Growth Markets registered sales of INR 3,490 mn for Q2 FY2022, up 4.9% compared to INR 3,328 mn in Q1 FY2022, up 19.6% as compared to INR 2,918 mn in Q2 FY2021; accounting for 9% of Lupin’s global sales.
Lupin’s Brazil sales were BRL 48 mn for Q2 FY2022 compared to BRL 63 mn for Q1 FY2022 and BRL 59 mn for Q2 FY2021.
Lupin’s Mexico sales were MXN 172 mn for Q2 FY2022 compared to MXN 163 mn for Q1 FY2022 and MXN 155 mn for Q2 FY2021.
Lupin’s Philippines sales were PHP 643 mn for Q2 FY2022 compared to PHP 362 mn for Q1 FY2022 and PHP 341 mn for Q2 FY2021.
Lupin’s Australia sales were AUD 18.3 mn for Q2 FY2022 compared to AUD 17.1 mn for Q1 FY2022 and AUD 14.4 mn for Q2 FY2021.
Europe, Middle-East and Africa (EMEA)
Lupin’s EMEA sales for Q2 FY2022 were INR 3,484 mn, up 33.3% compared to INR 2,613 mn in Q1 FY2022, up 6.9% compared to INR 3,259 mn in Q2 FY2021; accounting for 9% of Lupin’s global sales.
Lupin’s South Africa sales for Q2 FY2022 were ZAR 357 mn, compared to ZAR 273 mn in Q1 FY2022 and ZAR 304 mn in Q2 FY2021.
Lupin is the 6th largest player in South Africa in the total generics market (IQVIA August 2021).
Lupin’s Germany sales for Q2 FY2022 were EUR 7.9 mn, compared to EUR 7.4 mn in Q1 FY2022 and EUR 8.1 mn in Q2 FY2021.
Global API
Lupin’s Global API sales for Q2 FY2022 were INR 2,678 mn, up 8.9% compared to INR 2,459 mn in Q1 FY2022, down 28.4% as compared to INR 3,739 mn in Q2 FY2021; accounting for 7% of Lupin’s global sales.
Research and Development
Investment in R&D amounted to INR 3,300 mn (8.2% of sales) for Q2 FY2022 as compared to INR 3,737 mn (8.8% of sales) for Q1 FY2022.
Lupin received approval for 1 ANDA from the U.S. FDA in the quarter. Cumulative ANDA filings with the U.S. FDA stand at 444 as of September 30, 2021, with the company having received 292 approvals to date.
The Company now has 51 First-to-File (FTF) filings including 20 exclusive FTF opportunities. Cumulative U.S. DMF filings stand at 202 as of September 30, 2021.
About Lupin
Lupin is an innovation-led transnational pharmaceutical company headquartered in Mumbai, India. The Company develops and commercializes a wide range of branded and generic formulations, biotechnology products and APIs in over 100 markets in the U.S., India, South Africa and across Asia Pacific (APAC), Latin America (LATAM), Europe and Middle-East regions.
The Company enjoys leadership position in the cardiovascular, anti-diabetic, and respiratory segments and has significant presence in the anti-infective, gastro-intestinal (GI), central nervous system (CNS) and women’s health areas. Lupin is the third largest pharmaceutical company in the U.S. by prescriptions. The company invested 9.6% of its revenue on research and development in FY21.
Lupin has 15 manufacturing sites, 7 research centres, more than 20,000 professionals working globally, and has been consistently recognized as a ‘Great Place to Work’ in the Biotechnology & Pharmaceuticals sector.
Please visit www.lupin.com for more information.
Follow us on Twitter: https://twitter.com/LupinGlobal |LinkedIn: https://www.linkedin.com/company/lupin Facebook: http://www.facebook.com/LupinWorld/
