


Mumbai, November 09, 2022: Pharma major Lupin Limited [BSE: 500257 | NSE: LUPIN] reported its financial performance for the quarter ending Sept 30, 2022. These unaudited results were taken on record by the Board of Directors at a meeting held today.
| Financial Highlights – Consolidated IND-AS |
| Particulars | Quarter | ||||
| Q2 FY2023 | Q1 FY2023 | QoQ Growth % | Q2 FY2022 | YoY Growth % | |
| Sales | 40,912 | 36,040 | ↑13.5% | 40,034 | ↑2.2% |
| EBITDA | 4,680 | 2,379 | ↑96.7% | 6,285 | ↓ 25.5% |
| EBITDA Margin (%) | 11.4% | 6.6% | ↑480 bps | 15.7% | ↓ 430 bps |
| PBT | 2,096 | 23 | ↑ 9013% | 3825* | ↓ 45.2% |
Income Statement highlights – Q2 FY2023
| Consolidated Financial Results Q2 FY2023 |
| Particulars | Q2 FY2023 | % of sales | Q1 FY2023 | % of sales | QoQ Gr% | Q2 FY2022 | % of sales | YoY Gr% |
| Sales | 40,912 | 100.0% | 36,040 | 100.0% | 13.5% | 40,034 | 100.0% | 2.2% |
| Other operating income | 543 | 1.3% | 1,398 | 3.9% | -61.2% | 879 | 2.2% | -38.2% |
| Total Revenue from operations | 41,455 | 101.3% | 37,438 | 103.9% | 10.7% | 40,913 | 102.2% | 1.3% |
| Material cost | 17,128 | 41.9% | 16,098 | 44.7% | 6.4% | 16,265 | 40.6% | 5.3% |
| Gross Profit (Excl. Other op. income) | 23,784 | 58.1% | 19,942 | 55.3% | 19.3% | 23,769 | 59.4% | 0.1% |
| Employee cost | 7,716 | 18.9% | 7,785 | 21.6% | -0.9% | 7,586 | 18.9% | 1.7% |
| Manufacturing & Other expenses | 12,268 | 30.0% | 11,916 | 33.1% | 3.0% | 11,425 | 28.5% | 7.4% |
| Other Income | 149 | 0.4% | 56 | 0.2% | 166.1% | 728 | 1.8% | -79.5% |
| Forex Loss / (Gain) | (188) | -0.5% | (684) | -1.9% | -72.6% | 80 | 0.2% | 335.0% |
| EBITDA | 4,680 | 11.4% | 2,379 | 6.6% | 96.7% | 6,285 | 15.7% | -25.5% |
| Depreciation, Amortization | 2,035 | 5.0% | 1,928 | 5.3% | 5.5% | 2,116 | 5.3% | -3.8% |
| EBIT | 2,645 | 6.5% | 451 | 1.3% | 486.5% | 4,169 | 10.4% | -36.6% |
| Finance cost | 549 | 1.3% | 428 | 1.2% | 28.2% | 344 | 0.9% | 59.6% |
| Adjusted Profit Before Tax (PBT) | 2,096 | 5.1% | 23 | 0.1% | 9013.0% | 3,825 | 9.6% | -45.2% |
| Business Compensation Expense1 | – | – | – | – | – | 18,796 | 47% | |
| Impairment Expense2 | – | – | – | – | – | 7,077 | 17.7% | |
| Profit Before Tax (PBT) | 2,096 | 5.1% | 23 | 0.1% | 9013.0% | (22,048) | -55.1% | 109.5% |
| Tax | 751 | 1.8% | 891 | 2.5% | (1,099) | -2.7% | ||
| Profit After Tax (PAT) | 1,345 | 3.3% | (868) | -2.4% | (20,949) | -52.3% | ||
| (+) Share of Profit from JV | – | – | – | – | – | – | – | – |
| (-) Non-Controlling Interest | 48 | 0.1% | 23 | 0.1% | 31 | 0.1% | ||
| Profit/(Loss) for the period | 1,297 | 3.2% | (891) | -2.5% | (20,980) | -52.4% | ||
2.Impairment Expense of INR 7,077 mn for impairment of Solosec® IP
| Consolidated Financial Results – H1 FY2023 |
| Particulars | H1 FY2023 | % of sales | H1 FY2022 | % of sales | YoY Gr% |
| Sales | 76,951 | 100.0% | 82,408 | 100.0% | -6.6% |
| Other operating income | 1,943 | 2.5% | 1,207 | 1.5% | 61.0% |
| Total Revenue from operations | 78,894 | 102.5% | 83,615 | 101.5% | -5.6% |
| Material cost | 33,226 | 43.2% | 31,545 | 38.3% | 5.3% |
| Gross Profit (Excl. Other op. income) | 43,725 | 56.8% | 50,863 | 61.7% | -14.0% |
| Employee cost | 15,501 | 20.1% | 15,423 | 18.7% | 0.5% |
| Manufacturing & Other expenses | 24,185 | 31.4% | 21,691 | 26.3% | 11.5% |
| Other Income | 205 | 0.3% | 963 | 1.2% | -78.7% |
| Forex Loss / (Gain) | (872) | -1.1% | (292) | -0.4% | 198.6% |
| EBITDA | 7,059 | 9.2% | 16,211 | 19.7% | -56.5% |
| Depreciation, Amortization | 3,963 | 5.2% | 4,204 | 5.1% | -5.7% |
| EBIT | 3,096 | 4.0% | 12,007 | 14.6% | -74.2% |
| Finance cost | 977 | 1.3% | 679 | 0.8% | 43.9% |
| Adjusted Profit Before Tax (PBT) | 2,119 | 2.8% | 11,328 | 13.7% | -81.3% |
| Business Compensation Expense1 | – | – | 18,796 | 22.8% | |
| Impairment Expense2 | – | – | 7,077 | 8.6% | |
| Profit Before Tax (PBT) | 2,119 | 2.8% | (14,545) | -17.6% | 114.6% |
| Tax | 1,642 | 2.1% | 924 | 1.1% | |
| Profit After Tax (PAT) | 477 | 0.6% | (15,469) | -18.8% | |
| (+) Share of Profit from JV | – | – | 2 | 0.0% | |
| (-) Non-Controlling Interest | 70 | 0.1% | 89 | 0.1% | |
| Profit/(Loss) for the period | 407 | 0.5% | (15,556) | -18.9% | |
2.Impairment Expense of INR 7,077 mn for impairment of Solosec® IP
| Sales Mix |
| Particulars | Q2 FY2023 | Q1 FY2023 | Growth QoQ | Q2 FY2022 | Growth YoY | |
| North America | 13,295 | 10,104 | 31.6% | 14,291 | -7% | |
| India | 15,841 | 14,920 | 6.2% | 15,435 | 2.6% | |
| Growth Markets | 4,449 | 4,237 | 5% | 3,490 | 27.5% | |
| EMEA | 3,842 | 3,335 | 15.2% | 3,484 | 10.3% | |
| ROW | 986 | 893 | 10.3% | 656 | 50% | |
| Total Formulations | 38,413 | 33,489 | 14.7% | 37,356 | 2.8% | |
| API | 2,499 | 2,551 | -2% | 2,678 | -6.7% | |
| Consolidated Sales | 40,912 | 36,040 | 13.5% | 40,034 | 2.2% |
| Operational Highlights |
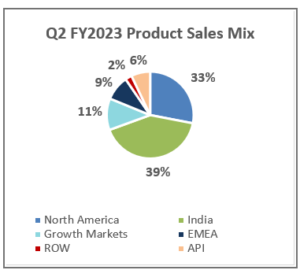
North America sales for Q2 FY2023 were INR 13,295 mn, up 31.6% compared to INR 10,104 mn in Q1 FY2023; down 7% as compared to INR 14,291 mn in Q2 FY2022; accounting for 33% of Lupin’s global sales.
Q2 FY2023 sales were USD 159 mn compared to USD 121 mn in Q1 FY2023 and USD 184 mn in Q2 FY2022.
The Company filed 8 ANDAs in the quarter, received 4 ANDA approvals from the U.S. FDA, and launched 3 products in the quarter in the U.S. The Company now has 168 generic products in the U.S.
Lupin continues to be the 3rd largest pharmaceutical player in both U.S. generic market and U.S. total market by prescriptions. (IQVIA Sept 2022) Lupin is the leader in 46 of its marketed generics in the U.S. and amongst the Top 3 in 110 of its marketed products. (IQVIA Sept 2022)
India
India formulation sales for Q2 FY2023 were INR 15,841 mn, up 6.2% as compared to INR 14,920 mn in Q1 FY2023; up 2.6% as compared to INR 15,435 mn in Q2 FY2022; accounting for 39% of Lupin’s global sales.
India Region Formulations sales grew by 5.8% in the quarter as compared to Q1 FY2023; up 5% as compared to Q2 FY2022. The company launched 6 brands across therapies during the quarter.
Lupin is the 6th largest company in the Indian Pharmaceutical Market (IQVIA MAT Sept 2022).
Growth Markets (LATAM and APAC)
Growth Markets registered sales of INR 4,449 mn for Q2 FY2023, up 5% compared to INR 4,237 mn in Q1 FY2023; up 27.5% as compared to INR 3,490 mn in Q2 FY2022; accounting for 11% of Lupin’s global sales.
Brazil sales were BRL 69 mn for Q2 FY2023, compared to BRL 57 mn for Q1 FY2023 and BRL 48 mn for Q2 FY2022.
Mexico sales were MXN 224 mn for Q2 FY2023, compared to MXN 213 mn for Q1 FY2023 and MXN 172 mn for Q2 FY2022.
Philippines sales were PHP 467 mn for Q2 FY2023, compared to PHP 434 mn for Q1 FY2023 and PHP 643 mn for Q2 FY2022.
Australia sales were AUD 25.6 mn for Q2 FY2023, compared to AUD 25.2 mn for Q1 FY2023 and AUD 18.3 mn for Q2 FY2022.
Europe, Middle-East and Africa (EMEA)
EMEA sales for Q2 FY2023 were INR 3,842 mn, up 15.2% compared to INR 3,335 mn in Q1 FY2023; up 10.3% compared to INR 3,484 mn in Q2 FY2022; accounting for 9% of Lupin’s global sales.
South Africa sales were ZAR 358 mn for Q2 FY2023, compared to ZAR 282 mn for Q1 FY2023 and ZAR 357 mn for Q2 FY2022. Lupin is the 8th largest player in South Africa in the total generics market (IQVIA Aug 2022).
Germany sales were EUR 9.9 mn for Q2 FY2023, compared to EUR 9.2 mn for Q1 FY2023 and EUR 7.9 mn for Q2 FY2022.
Global API
Global API Sales for Q2 FY2023 were INR 2,499 mn, down 2% as compared to INR 2,551 mn in Q1 FY2023; down 6.7% as compared to INR 2,678 mn in Q2 FY2022; accounting for 6% of Lupin’s global sales.
Research and Development
Investment in R&D was INR 3,376 mn (8.3% of sales) for Q2 FY2023 as compared to INR 3,300 mn (8.2% of sales) for Q2 FY2022.
Lupin received approval for 4 ANDAs from the U.S. FDA in the quarter. Cumulative ANDA filings with the U.S. FDA stand at 467 as of Sept 30, 2022, with the company having received 305 approvals to date.
The Company now has 54 First-to-File (FTF) filings including 20 exclusive FTF opportunities. Cumulative U.S. DMF filings stand at 170 as of Sept 30, 2022.
About Lupin
Lupin is an innovation-led transnational pharmaceutical company headquartered in Mumbai, India. The Company develops and commercializes a wide range of branded and generic formulations, biotechnology products, and APIs in over 100 markets in the U.S., India, South Africa, and across the Asia Pacific (APAC), Latin America (LATAM), Europe, and Middle East regions.
The Company enjoys a leadership position in the cardiovascular, anti-diabetic, and respiratory segments and has a significant presence in the anti-infective, gastro-intestinal (GI), central nervous system (CNS), and women’s health areas. Lupin is the third-largest pharmaceutical company in the U.S. by prescriptions. The company invested 8.7% of its revenue in research and development in FY22.
Lupin has 15 manufacturing sites, 7 research centers, more than 20,000 professionals working globally, and has been consistently recognized as a ‘Great Place to Work’ in the Biotechnology & Pharmaceuticals sector.
Please visit www.lupin.com for more information. Follow us on Twitter: https://twitter.com/LupinGlobal LinkedIn : https://www.linkedin.com/company/lupin Facebook: http://www.facebook.com/LupinWorld/
For further information or queries please contact –
Shweta Munjal Vice President & Global Head – Corporate Communications Email: shwetamunjal@lupin.com
