


Mumbai: Pharma major Lupin Limited [BSE: 500257 | NSE: LUPIN] reported its financial performance for the quarter and fiscal year ending March 31, 2021. These audited results were taken on record by the Board of Directors at a meeting held today. The Board recommended a dividend of 325%.
Financial Highlights (from Continuing Operations) – Consolidated IND-AS
Amt in INR mn
| Particulars | Quarter | Full Year | ||||||
| Q4 FY2021 | Q3 FY2021 | QoQ Growth % | Q4 FY2020 | YoY Growth % | FY2021 | FY2020 | YoY Growth % | |
| Sales | 37,593 | 39,173 | 4.0% | 37,910 | 0.8% | 149,270 | 151,428 | – 1.4% |
| EBITDA before Forex & Other Income | 7,075 | 8,064 | 12.3% | 5,237 | 35.1% | 26,578 | 23,633 | 12.5% |
| EBITDA Margin (%) | 18.8% | 20.6% | 180 bps | 13.8% | 500 bps | 17.8% | 15.6% | 220 bps |
| PBT before Exceptional items | 5,182 | 5,247 | 1.2% | 4,123 | 25.7% | 16,751 | 15,054 | 11.3% |
| PBT after Exceptional Items | 5,182 | 5,247 | 1.2% | 4,954 | NA | 16,751 | 7,533 | NA |
Consolidated Financial Results – Q4 FY2021
Amt in INR mn
| Particulars | Q4 FY2021 | % of sales | Q3 FY2021 | % of sales | QoQ Growth % | Q4 FY2020 | % of sales | YoY Growth % |
| Sales | 37,593 | 100.0% | 39,173 | 100.0% | -4.0% | 37,910 | 100.0% | -0.8% |
| Other operating income | 238 | 0.6% | 1,001 | 2.6% | -76.2% | 547 | 1.4% | -56.5% |
| Total Revenue from operations | 37,831 | 100.6% | 40,174 | 102.6% | -5.8% | 38,457 | 101.4% | -1.6% |
| Material cost | 13,176 | 35.0% | 13,750 | 35.1% | -4.2% | 14,050 | 37.1% | -6.2% |
| Gross Profit (Excl. Other op. income) | 24,417 | 65.0% | 25,423 | 64.9% | -4.0% | 23,860 | 62.9% | 2.3% |
| Employee cost | 6,402 | 17.0% | 7,068 | 18.0% | -9.4% | 7,635 | 20.1% | -16.1% |
| Manufacturing & Other expenses | 11,178 | 29.7% | 11,569 | 29.5% | -3.4% | 11,519 | 30.4% | -3.0% |
| Other Income | 582 | 1.5% | 212 | 0.5% | 174.5% | 2,086 | 5.5% | -72.1% |
| EBITDA | 7,657 | 20.4% | 7,999 | 20.4% | -4.3% | 7,339 | 19.4% | 4.3% |
| Depreciation, Amortization & Impairment Expense | 2,157 | 5.7% | 2,44 | 6.2% | -11.7% | 2,142 | 5.7% | 0.7% |
| EBIT | 5,500 | 14.6% | 5,556 | 14.2% | -1.0% | 5,197 | 13.7% | 5.8% |
| Finance cost | 318 | 0.8% | 309 | 0.8% | 2.9% | 1,074 | 2.8% | -70.4% |
| PBT before Exceptional items | 5,182 | 13.8% | 5,247 | 13.4% | -1.2% | 4,123 | 10.9% | 25.7% |
| Exceptional items | – | 0.0% | – | 0.0% | NA | (831) | -2.2% | NA |
| PBT after Exceptional items | 5,182 | 13.8% | 5,247 | 13.4% | -1.2% | 4,954 | 13.1% | 4.6% |
| Tax | 540 | 1.4% | 835 | 2.1% | 35.3% | 1,051 | 2.8% | -48.6% |
| Profit after Tax | 4,642 | 12.3% | 4,412 | 11.3% | 5.2% | 3,903 | 10.3% | 18.9% |
| (+) Share of Profit from JV | 2 | 0.0% | 2 | 0.0% | 0% | 10 | 0.0% | -80.0% |
| (-) Non-Controlling Interest | 40 | 0.1% | 31 | 0.1% | 29.0% | 17 | 0.0% | 35.3% |
| Profit/(Loss) for the period | 4,604 | 12.2% | 4,383 | 11.2% | 5.0% | 3,896 | 10.3% | 18.2% |
Amt in INR mn
| Particulars | FY2021 | % of sales | FY2020 | % of sales | YoY Growth % |
| Sales | 149,270 | 100.0% | 151,428 | 100.0% | -1.4% |
| Other operating income | 2,360 | 1.6% | 2,320 | 1.5% | 1.7% |
| Total Revenue from operations | 51,630 | 101.6% | 153,748 | 101.5% | -1.4% |
| Material cost | 53,622 | 35.9% | 54,306 | 35.9% | -1.3% |
| Gross Profit (Excl. Other op. income) | 95,648 | 64.1% | 97,122 | 64.1% | -1.5% |
| Employee cost | 28,259 | 18.9% | 29,868 | 19.7% | -5.4% |
| Manufacturing & Other expenses | 44,080 | 29.5% | 46,025 | 30.4% | -4.2% |
| Other Income | 1,363 | 0.9% | 4,837 | 3.2% | -71.8% |
| EBITDA | 27,032 | 18.1% | 28,386 | 18.7% | -4.8% |
| Depreciation, Amortization & Impairment Expense | 8,874 | 5.9% | 9,703 | 6.4% | –8.5% |
| EBIT | 18,158 | 12.2% | 18,683 | 12.3% | -2.8% |
| Finance cost | 1,407 | 0.9% | 3,629 | 2.4% | -61.2% |
| PBT before Exceptional items | 16,751 | 11.2% | 15,054 | 9.9% | 11.3% |
| Exceptional items | – | 0.0% | 7,521 | 5.0% | NA |
| PBT after Exceptional items | 16,751 | 11.2% | 7,533 | 5.0% | NA |
| Tax | 4,485 | 3.0% | 11,571 | 7.6% | -61.2% |
| Profit after Tax | 12,266 | 8.2% | (4,038) | -2.7% | NA |
| (+) Share of Profit from JV | 13 | 0.0% | 39 | 0.0% | |
| (-) Non-Controlling Interest | 114 | 0.1% | (4) | 0.0% | NA |
| Net Profit from continuing operations | 12,165 | 8.1% | (3,995) | -2.6% | NA |
| Profit/(Loss) from discontinued operations | 0 | NA | 1,301 | 0.9% | NA |
| Profit/(Loss) for the period | 12,165 | 8.1% | (2,694) | -1.8% | NA |
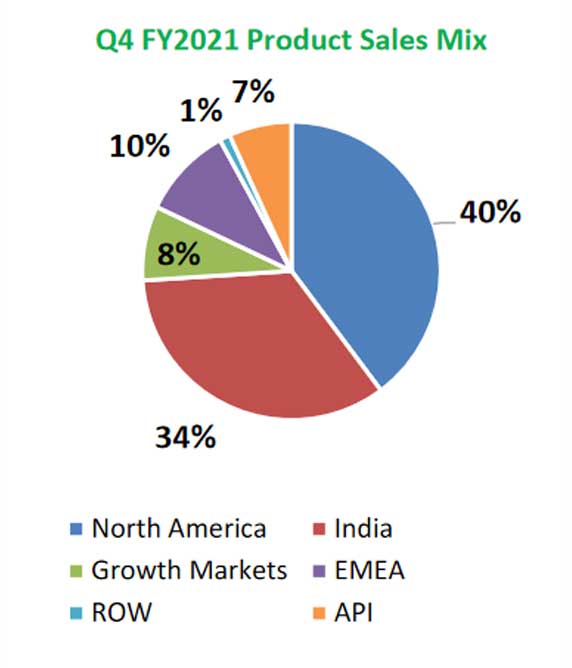
| Particulars | Q4 FY2021 | Q3FY2021 | Growth QoQ | Q4FY2020 | Growth YoY |
| North America | 14,952 | 14,424 | 3.7% | 15,791 | -5.3% |
| India | 12,866 | 13,669 | -5.9% | 11,920 | 7.9% |
| Growth Markets | 3,033 | 3,314 | -8.5% | 2,800 | 8.3% |
| EMEA | 3,749 | 3,272 | 14.6% | 3,650 | 2.7% |
| ROW | 437 | 1,056 | -58.5% | 463 | -5.5% |
| Total Formulations | 35,037 | 35,735 | -2.0% | 34,624 | 1.2% |
| API | 2,556 | 3,438 | 25.6% | 3,286 | -22.2% |
| Consolidated Sales | 37,593 | 39,173 | -4.0% | 37,910 | -0.8% |
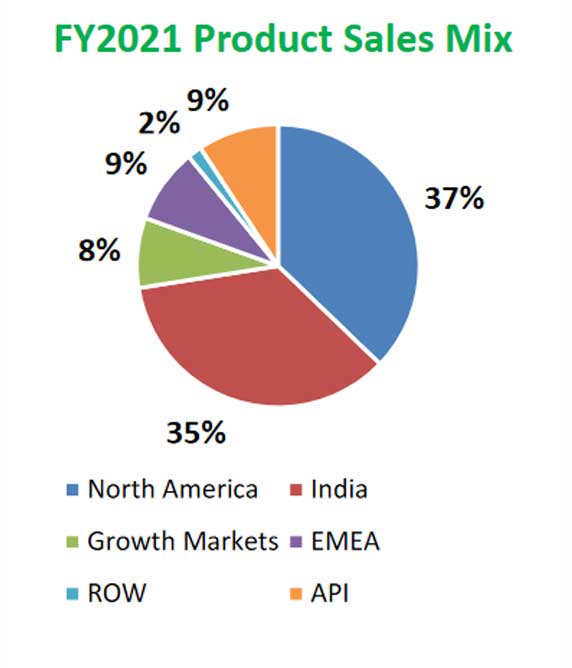
| Particulars | FY2021 | FY2021 | Growth QoQ |
| North America | 55,520 | 58,212 | -4.6% |
| India | 52,712 | 51,385 | 2.6% |
| Growth Markets | 11,964 | 12,212 | -2.0% |
| EMEA | 12,781 | 12,364 | 3.4% |
| ROW | 2,470 | 2,815 | -12.2% |
| Total Formulations | 135,447 | 136,988 | -1.1% |
| API | 13,823 | 12,999 | 6.3% |
| Total Product Sales | 149,270 | 149,987 | -0.5% |
| NCE Licensing Income | – | 1,441 | NA |
| Consolidated Sales | 149,270 | 151,428 | -1.4% |
Operational Highlights
North America
Lupin’s North America sales for FY2021 were INR 55,520 mn compared to INR 58,212 mn in FY 2020; accounting for 37% of Lupin’s global sales. Q4 FY2021 sales were INR 14,952 mn, up 3.7% compared to INR 14,424 mn during Q3 FY2021 and sales of INR 15,791 mn during Q4 FY2020.
Lupin’s India formulation sales for FY2021 were INR 52,712 mn, up 2.6% as compared to INR 51,385 mn in FY2020; accounting for 35% of Lupin’s global sales. Q4 FY2021 sales were INR 12,866 mn, compared to sales of INR 13,669 mn during Q3 FY2021 and up 7.9% compared to sales of INR 11,920 mn during Q4 FY2020.
Lupin is the 6th largest company in the Indian Pharmaceutical Market (IQVIA MAT March 2021).
Growth Markets (LATAM and APAC)
Lupin’s LATAM & APAC regions together form its Growth Markets. Growth Markets sales for FY2021 were INR 11,964 mn, compared to INR 12,212 mn in FY2020; accounting for 8% of Lupin’s global sales. Q4 FY2021 sales were INR 3,033 mn, compared to sales of INR 3,314 mn during Q3 FY2021 and up 8.3% as compared to sales of INR 2,800 mn during Q4 FY2020.
Lupin’s Brazil sales were BRL 239 mn for FY2021, compared to a sales of BRL 177 mn for FY2020. Q4 FY2021 sales were BRL 59 mn, compared to BRL 66 mn during Q3 FY2021 and BRL 37 mn during Q4 FY2020.
Lupin’s Mexico sales were MXN 621 mn for FY2021, compared to a sales of MXN 691 mn for FY2020. Q4 FY2021 sales were MXN 154 mn, compared to MXN 188 mn during Q3 FY2021 and MXN 171 mn during Q4 FY2020.
Lupin’s Philippines sales were PHP 1,388 mn for FY2021, compared to a sales of PHP 1,874 mn for FY2020. Q4 FY2021 sales were PHP 402 mn, compared to PHP 367 mn during Q3 FY2021 and PHP 522 mn during Q4 FY2020.
Lupin’s Australia sales were AUD 57 mn for FY2021, compared to a sales of AUD 48 mn for FY2020. Q4 FY2021 sales were AUD 14.2 mn, compared to AUD 15.7 mn during Q3 FY2021 and AUD 13.0 mn during Q4 FY2020.
Europe, Middle-East and Africa (EMEA)
Lupin’s EMEA sales for FY2021 were INR 12,781 mn, up 3.4% as compared to INR 12,364 mn in FY 2020; accounting for 9% of Lupin’s global sales. Q4 FY2021 sales were INR 3,749 mn, up 14.6% compared to sales of INR 3,272 mn during Q3 FY2021 and up 2.7% as compared to sales of INR 3,650 mn during Q4 FY2020.
Lupin’s South Africa sales were ZAR 1,295 mn for FY2021, compared to a sales of ZAR 1,219 mn for FY2020. Q4 FY2021 sales were ZAR 431 mn, compared to ZAR 323 mn during Q3 FY2021 and ZAR 374 mn during Q4 FY2020.
Lupin is the 4th largest generic player in the South African market by prescription (IQVIA February 2021).
Lupin’s Germany sales were EUR 29.2 mn for FY2021, compared to a sales of EUR 36.2 mn for FY2020. Q4 FY2021 sales were EUR 5.4 mn, compared to EUR 8.1 mn during Q3 FY2021 and EUR 9.3 mn during Q4 FY2020. 3 FY2021 were EUR 8.1 mn, compared to EUR 8.1 mn during Q2 FY2021 and EUR 9.5 mn during Q3 FY2020.
Global API
Lupin’s Global API sales for FY2021 were INR 13,823 mn, up 6.3% as compared to INR 12,999 mn in FY 2020; accounting for 9% of Lupin’s global sales. Q4 FY2021 sales were INR 2,556 mn, compared to sales of INR 3,438 mn during Q3 FY2021 and sales of INR 3,286 mn during Q4 FY2020.
Research and Development
Investment in R&D for continued operations amounted to INR 14,324 mn (9.6% of sales) for FY2021 and INR 3,427 mn (9.1% of sales) for Q4 FY2021.
Lupin received approval for 6 ANDA from the U.S. FDA during the quarter. Cumulative ANDA filings with the US FDA stood at 437 as of March 31, 2021, with the company having received 288 approvals to date.
The Company now has 45 First-to-Files (FTF) filings including 16 exclusive FTF opportunities. Cumulative DMF filings stand at 201 as of March 31, 2021.
About Lupin Limited
Lupin is an innovation-led transnational pharmaceutical company headquartered in Mumbai, India. The Company develops and commercializes a wide range of branded and generic formulations, biotechnology products and APIs in over 100 markets in the U.S., India, South Africa and across Asia Pacific (APAC), Latin America (LATAM), Europe and MiddleEast regions.
The Company enjoys leadership position in the cardiovascular, anti-diabetic, and respiratory segments and has significant presence in the anti-infective, gastro-intestinal (GI), central nervous system (CNS) and women’s health areas. Lupin is the third largest pharmaceutical company in the U.S. by prescriptions. In FY2021, the Company invested 9.6% of its revenues on research and development.
Lupin has 15 manufacturing sites, 7 research centers, more than 20,000 professionals working globally, and has been consistently recognized as a ‘Great Place to Work’ in the Biotechnology & Pharmaceuticals sector.
Please visit www.lupin.com for more information.
Follow us on
Twitter: https://twitter.com/LupinGlobal LinkedIn: https://www.linkedin.com/company/lupin Facebook: http://www.facebook.com/LupinWorld/
For further information or queries please contact –
| Arvind Bothra
Head – Investor Relations / Corporate M&A Email: arvindbothra@lupin.com Tel: +91-22 6640 8237 | Shweta Munjal
Head – Corporate Communications Email: shwetamunjal@lupin.com Tel: +91-22-6640 2532 |
