


Mumbai, May 07, 2026: Pharma major Lupin Limited [BSE: 500257 | NSE: LUPIN] reported its financial performance for the quarter and fiscal year ending March 31, 2026. These audited results were taken on record by the Board of Directors at a meeting held today. Based on the long-term outlook the Board has recommended a dividend of 900%.
Financial Highlights – Consolidated IND-AS
Amt in INR Mn
| Particulars | Full Year | Quarter | ||||||
| FY2026 | FY2025 | YoY Growth % | Q4 FY2026 | Q4 FY2025 | YoY Growth % | Q3 FY2026 | QoQ Growth % | |
| Sales | 2,74,875 | 221,921 | ↑23.9% | 73,919 | 55,622 | ↑ 32.9% | 71,005 | ↑ 4.1% |
| EBITDA | 92,405 | 54,792 | ↑68.6% | 26,263 | 13,781 | ↑ 90.6% | 23,766 | ↑ 10.5% |
| EBITDA Margin (%)* | 33.6% | 24.7% | ↑ 890 bps | 35.5% | 24.8% | ↑ 1070 bps | 33.5% | ↑ 200 bps |
| PBT | 68,726 | 40,150 | ↑71.2% | 19,280 | 8,958 | ↑ 115.2% | 15,220 | ↑ 26.7% |
| PAT | 53,555 | 33,063 | ↑62.0% | 14,687 | 7,824 | ↑ 87.7% | 11,805 | ↑ 24.4% |
*Includes forex & other income
Income Statement highlights – Q4 FY2026
Balance Sheet highlights
Mr. Nilesh Gupta, Managing Director, Lupin Limited said “Our fourth quarter and full-year results underscore the strength and resilience of our business across key geographies, with the U.S. and India delivering strong sales growth and margin expansion. Building on this momentum, we are well-positioned to accelerate performance through strategic investments in technology, disciplined execution, and operational efficiencies, driving sustainable and profitable growth”.
Amt in INR Mn
| Particulars | FY2026 | % of sales | FY2025 | % of sales | YOY Gr% |
| Sales | 2,74,875 | 100.0% | 221,921 | 100.0% | ↑ 23.9% |
| Other operating income | 4,705 | 1.7% | 5,158 | 2.3% | ↓ 8.8% |
| Total Revenue from operations | 2,79,580 | 101.7% | 227,079 | 102.3% | ↑ 23.1% |
| Material cost | 73,265 | 26.7% | 68,422 | 30.8% | ↑ 7.1% |
| Gross Profit (Excl. Other op. income) | 201,610 | 73.3% | 153,499 | 69.2% | ↑ 31.3% |
| Employee cost | 45,745 | 16.6% | 39,642 | 17.9% | ↑ 15.4% |
| Manufacturing & Other expenses | 78,975 | 28.7% | 66,239 | 29.8% | ↑ 19.2% |
| Other Income | 4,245 | 1.5% | 1,958 | 0.9% | ↑ 116.8% |
| Forex Loss / (Gain) | (6,565) | -2.4% | (58) | -0.0% | NA |
| EBITDA | 92,405 | 33.6% | 54,792 | 24.7% | ↑ 68.6% |
| Depreciation, Amortization & Impairment Expense | 13,755 | 5.0% | 11,693 | 5.3% | ↑ 17.6% |
| EBIT | 78,650 | 28.6% | 43,099 | 19.4% | ↑ 82.5% |
| Finance cost | 4,345 | 1.6% | 2,949 | 1.3% | ↑ 47.3% |
| Profit Before Tax (PBT) and Exceptional items | 74,305 | 27.0% | 40,150 | 18.1% | ↑ 85.1% |
| Exceptional items (Net) | 5,579 | 2.0% | - | - | NA |
| Profit Before Tax (PBT) | 68,726 | 25.0% | 40,150 | 18.1% | ↑ 71.2% |
| Tax | 15,171 | 5.5% | 7,087 | 3.2% | ↑114.1% |
| Profit After Tax (PAT) | 53,555 | 19.5% | 33,063 | 14.9% | ↑ 62.0% |
| (+) Share of Profit from JV | - | - | - | - | - |
| (-) Non-Controlling Interest | 226 | 0.1% | 247 | 0.1% | ↓ 8.5% |
| Profit/(Loss) for the year | 53,329 | 19.4% | 32,816 | 14.8% | ↑ 62.5% |
Amt in INR Mn
| Particulars | Q4 FY2026 | % of sales | Q4 FY2025 | % of sales | YoY Gr% | Q3 FY2026 | % of sales | QoQ Gr% |
| Sales | 73,919 | 100.0% | 55,622 | 100.0% | ↑ 32.9% | 71,005 | 100.0% | ↑ 4.1% |
| Other operating income | 828 | 1.1% | 1,049 | 1.9% | ↓ 21.1% | 670 | 0.9% | ↑ 23.6% |
| Total Revenue from operations | 74,747 | 101.1% | 56,671 | 101.9% | ↑ 31.9% | 71,675 | 100.9% | ↑ 4.3% |
| Material cost | 18,516 | 25.0% | 16,862 | 30.3% | ↑ 9.8% | 18,781 | 26.5% | ↓ 1.4% |
| Gross Profit (Excl. Other op. income) | 55,403 | 75.0% | 38,760 | 69.7% | ↑ 42.9% | 52,224 | 73.5% | ↑ 6.1% |
| Employee cost | 12,427 | 16.8% | 10,013 | 18.0% | ↑ 24.1% | 11,433 | 16.1% | ↑ 8.7% |
| Manufacturing & Other expenses | 22,093 | 29.9% | 16,876 | 30.3% | ↑ 30.9% | 19,366 | 27.3% | ↑ 14.1% |
| Other Income | 1,407 | 1.9% | 570 | 1.0% | ↑ 146.8% | 1,147 | 1.6% | ↑ 22.7% |
| Forex Loss / (Gain) | (3,145) | -4.3% | (291) | -0.5% | ↑ 980.8% | (524) | -0.7% | ↑ 500.2% |
| EBITDA | 26,263 | 35.5% | 13,781 | 24.8% | ↑ 90.6% | 23,766 | 33.5% | ↑10.5% |
| Depreciation, Amortization & Impairment Expense | 4,468 | 6.0% | 3,932 | 7.1% | ↑ 13.6% | 3,130 | 4.4% | ↑ 42.7% |
| EBIT | 21,795 | 29.5% | 9,849 | 17.7% | ↑ 121.3% | 20,636 | 29.1% | ↑ 5.6% |
| Finance cost | 1,202 | 1.6% | 891 | 1.6% | ↑ 34.9% | 1,150 | 1.6 % | ↑ 4.5% |
| Profit Before Tax (PBT) and Exceptional items | 20,593 | 27.9% | 8,958 | 16.1% | ↑ 129.9% | 19,486 | 27.4% | ↑ 5.7% |
| Exceptional items (Net) | 1,313 | 1.8% | - | - | NA | 4,266 | 6.0% | ↓ 69.2% |
| Profit Before Tax (PBT) | 19,280 | 26.1% | 8,958 | 16.1% | ↑ 115.2% | 15,220 | 21.4% | ↑ 26.7% |
| Tax | 4,593 | 6.2% | 1,134 | 2.0% | ↑ 305.0% | 3,415 | 4.8% | ↑ 34.5% |
| Profit After Tax (PAT) | 14,687 | 19.9% | 7,824 | 14.1% | ↑ 87.7% | 11,805 | 16.6% | ↑ 24.4% |
| (+) Share of Profit from JV | - | - | - | - | - | - | - | - |
| (-) Non-Controlling Interest | 83 | 0.0% | 99 | 0.2% | ↓ 16.2% | 49 | 0.1% | ↑69.4% |
| Profit/(Loss) for the period | 14,604 | 19.8% | 7,725 | 13.9% | ↑ 89.0% | 11,756 | 16.6% | ↑ 24.2% |
Amount in INR Mn
| Particulars | FY2026 | FY2025 | Growth YOY |
| U.S. | 116,783 | 79,976 | ↑ 46.0% |
| India | 81,140 | 75,773 | ↑ 7.1% |
| Other Developed Markets | 32,439 | 28,641 | ↑ 13.3% |
| Emerging Markets | 34,828 | 25,759 | ↑ 35.2% |
| Total Formulations | 265,190 | 210,149 | ↑ 26.2% |
| API | 9,685 | 11,772 | ↓17.7% |
| Total Product Sales | 274,875 | 221,921 | ↑23.9% |
* Note: FY2025 have been regrouped for comparison
Amount in INR Mn
| Particulars | Q4 FY2026 | Q4 FY2025 | Growth YOY | Q3 FY2026 | Growth QOQ |
| U.S. | 33,987 | 21,666 | 56.9% | 31,132 | 9.2% |
| India | 19,082 | 17,113 | 11.5% | 20,387 | -6.4% |
| Other Developed Markets | 8,453 | 7,889 | 7.1% | 8,121 | 4.1% |
| Emerging Markets | 9,906 | 6,639 | 49.2% | 9,170 | 8.0% |
| Total Formulations | 71,428 | 53,307 | 34.0% | 68,810 | 3.8% |
| API | 2,491 | 2,315 | 7.6% | 2,195 | 13.5% |
| Total Product Sales | 73,919 | 55,622 | 32.9% | 71,005 | 4.1% |
* Note: FY2025 have been regrouped for comparison
U.S.
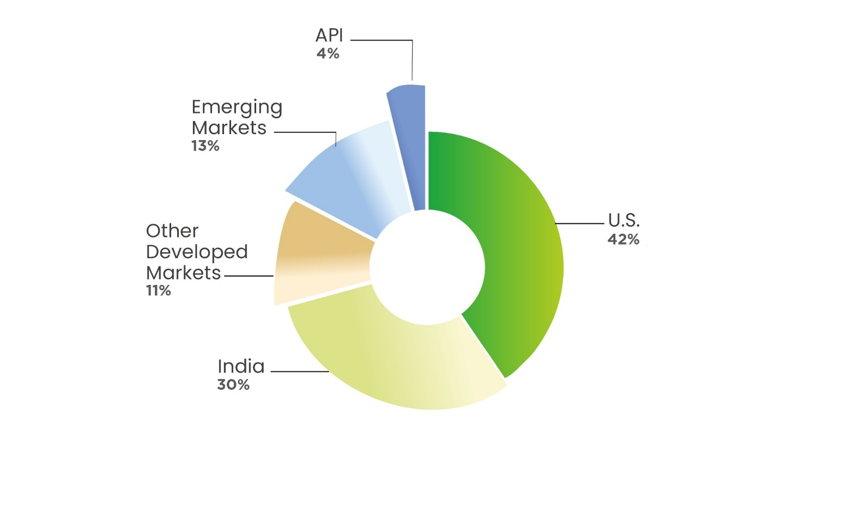
U.S. sales for FY2026 were INR 116,783 Mn, up 46.0% as compared to INR 79,976 Mn in FY2025 (U.S. FY2026 sales were USD 1,318 Mn compared to USD 944 Mn in FY2025); accounting for 42% of Lupin’s global sales.
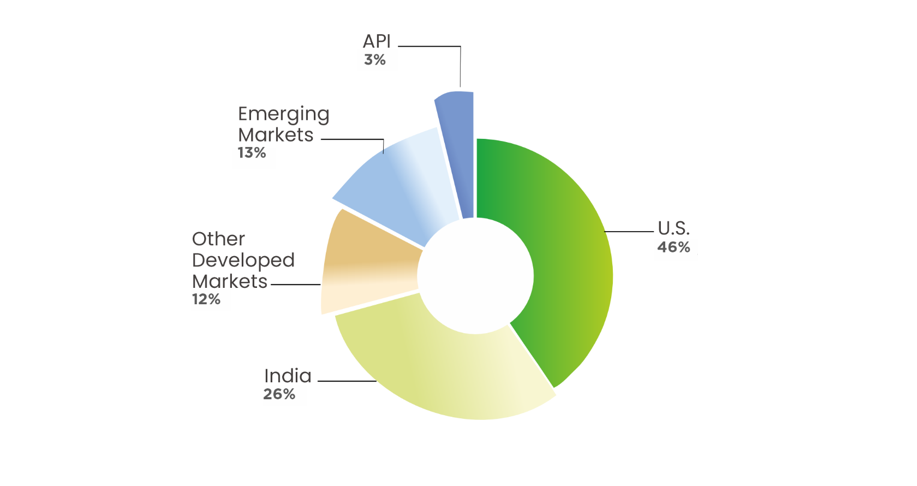
U.S. sales for Q4 FY2026 were INR 33,987 Mn, up 56.9% compared to INR 21,666 Mn in Q4 FY2025 (U.S. Q4 FY2026 sales were USD 371 Mn compared to USD 250 Mn in Q4 FY2025); accounting for 46% of Lupin’s global sales.
The Company received 3 ANDA approvals from the U.S. FDA, and launched 3 products in the quarter in the U.S. The Company now has 151 generic products in the U.S Market.
Lupin continues to be the 3rd largest pharmaceutical player in both U.S. generic market and U.S. total market by prescriptions (IQVIA Qtr TRx March 2026). Lupin is the leader in 61 of its marketed generics in the U.S. and amongst the Top 3 in 112 of its marketed products (IQVIA Qtr March 2026).
India
India sales for FY2026 were INR 81,140 Mn, up 7.1% as compared to INR 75,773 Mn in FY2025; accounting for 30% of Lupin’s global sales.
Q4 FY2026 sales were INR 19,082 Mn, up 11.5% compared to INR 17,113 Mn in Q4 FY2025; accounting for 26% of Lupin’s global sales.
India Region Formulation sales up by 14.5% in the quarter as compared to Q4 FY2025. The company launched 3 brands across therapies during the quarter. Lupin is the 8th largest company in the Indian Pharmaceutical Market (IQVIA MAT Mar 2026).
Other Developed Markets
Other Developed Markets sales for FY2026 were INR 32,439 Mn, up 13.3% as compared to INR 28,641 Mn in FY 2025; accounting for 11% of Lupin’s global sales.
Q4 FY2026 sales were INR 8,453 Mn, up 7.1% compared to INR 7,889 Mn in Q4 FY2025; accounting for 12% of Lupin’s global sales.
Emerging Markets
Emerging Markets sales for FY2026 were INR 34,828 Mn, up 35.2% as compared to INR 25,759 Mn in FY2025.
accounting for 13% of Lupin’s global sales.
Q4 FY2026 sales were INR 9,906 Mn, up 49.2% compared to INR 6,639 Mn in Q4 FY2025; accounting for 13% of Lupin’s global sales.
Global API
Global API sales for FY2026 were INR 9,685 Mn, down 17.7% as compared to INR 11,772 Mn in FY2025; accounting for 4% of Lupin’s global sales.
Q4 FY2026 sales were INR 2,491 Mn, up 7.6% compared to INR 2,315 Mn in Q4 FY2025; accounting for 3% of Lupin’s global sales.
Research and Development
Investment in R&D was INR 20,631 Mn (7.5% of sales) for FY2026 compared to INR 17,968 Mn (8.1% of Sales) in FY2025; Further, it is INR 5,898 Mn (8.0 % of sales) for Q4 FY2026, compared to INR 5,430 Mn (9.8% of sales) for Q4 FY2025.
Lupin received approval for 3 ANDAs from the U.S. FDA in the quarter. Cumulative ANDA filings with the U.S. FDA stand at 430 as of March 31, 2026, with the company having received 344 approvals to date.
The Company now has 52 First-to-File (FTF) filings including 22 exclusive FTF opportunities. Cumulative U.S. DMF filings stand at 94 as of March 31, 2026.
About Lupin
Lupin Limited is a global pharmaceutical leader headquartered in Mumbai, India, with products distributed in over 100 markets. Lupin specializes in pharmaceutical products, including branded and generic formulations, complex generics, biotechnology products, and active pharmaceutical ingredients. Trusted by healthcare professionals and consumers globally, the company enjoys a strong position in India and the U.S. across multiple therapy areas, including respiratory, cardiovascular, anti-diabetic, anti-infective, gastrointestinal, central nervous system, and women's health. Lupin has 15 state-of-the-art manufacturing sites and 7 research centers globally, along with a dedicated workforce of over 24,000 professionals. Lupin is committed to improving patient health outcomes through its subsidiaries - Lupin Diagnostics, Lupin Digital Health, and Lupin Manufacturing Solutions.
To know more, visit www.lupin.com or follow us on LinkedIn https://www.linkedin.com/company/lupin
For further information or queries please contact –
Rajalakshmi Azariah
Vice President & Global Head – Corporate Communications, Lupin
rajalakshmiazariah@lupin.com

